Custom Dashboards for Quick Analysis: How Solara Supports Educators

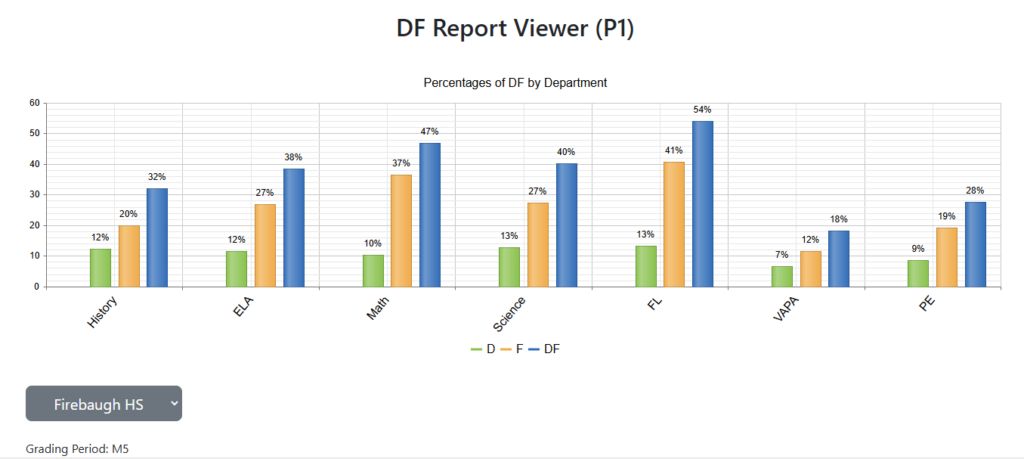
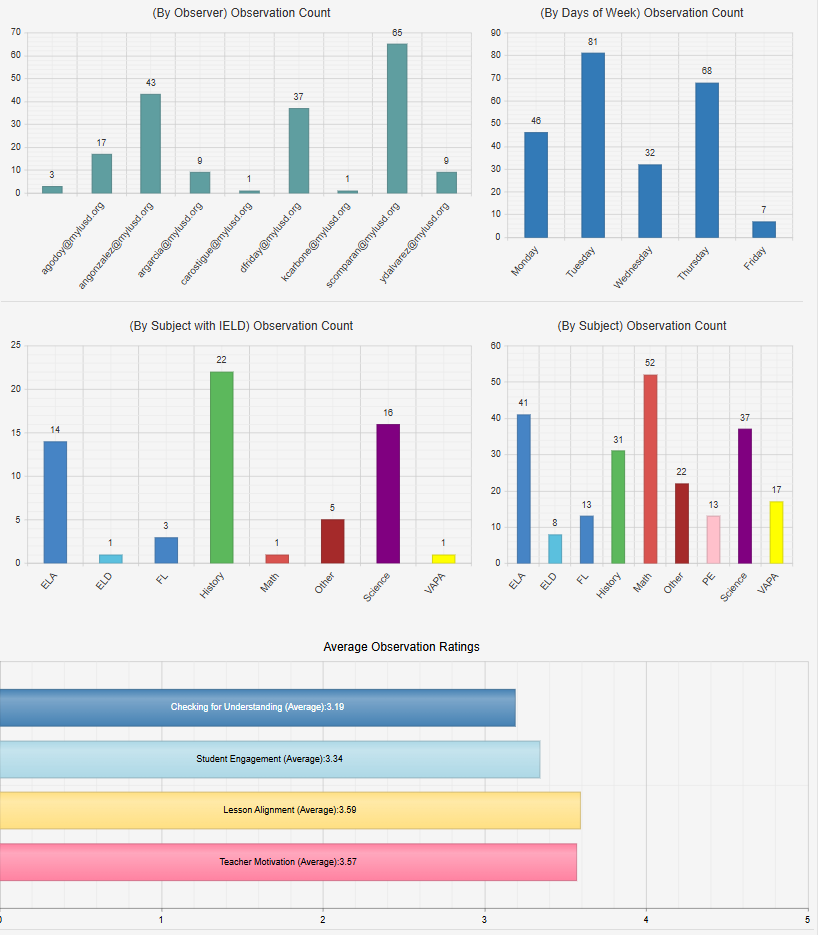
Panorama: Solara offers customizable dashboards that help educators and teams monitor student success indicators.
Data-Driven Actions: How Innovare Helps Educators Identify Root Causes
Innovare pairs robust back-end categorization with front-end plain language summaries, ensuring educators immediately understand the root cause behind every early warning indicator flag.
Empowering Schools, Ensuring Coherence: How D11’s Integrated Dashboards Align Interventions to Research-Informed Risk Level
So What
Being able to produce clear and actionable reporting for each critical role on the team is key to effective Student Success Systems.
Context Setting
Before implementing the early warning indicator system (EWIS), Colorado Springs School District 11 (D11) experienced challenges with fragmented data systems and system customization. Without being able to customize thresholds for their own on-track data, they were unable to provide clear and actionable information to different roles on the Student Success Team.
Innovation/Partnership
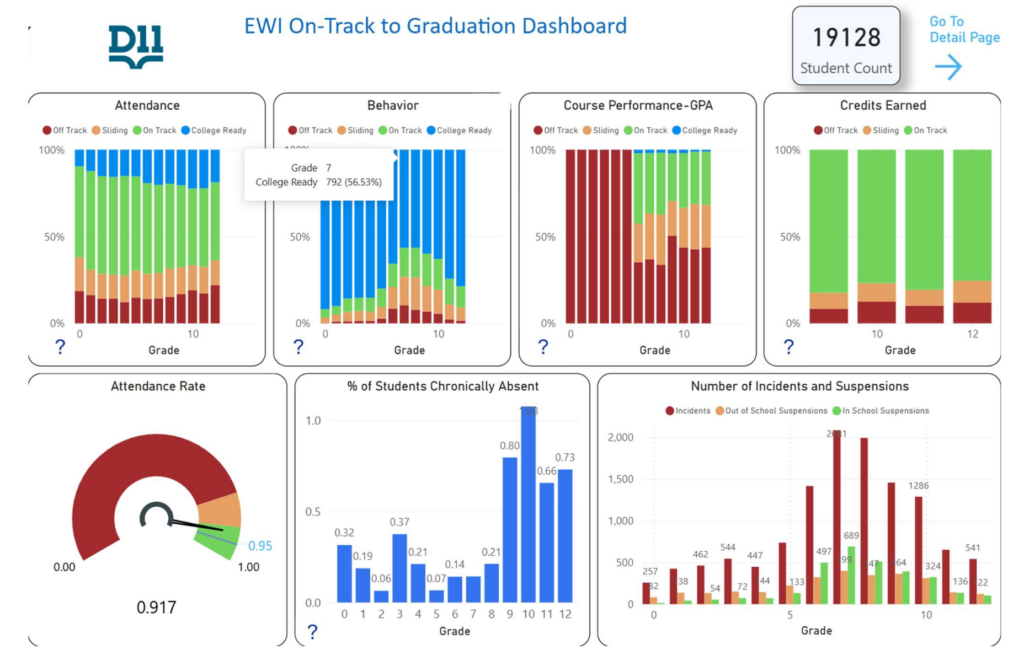
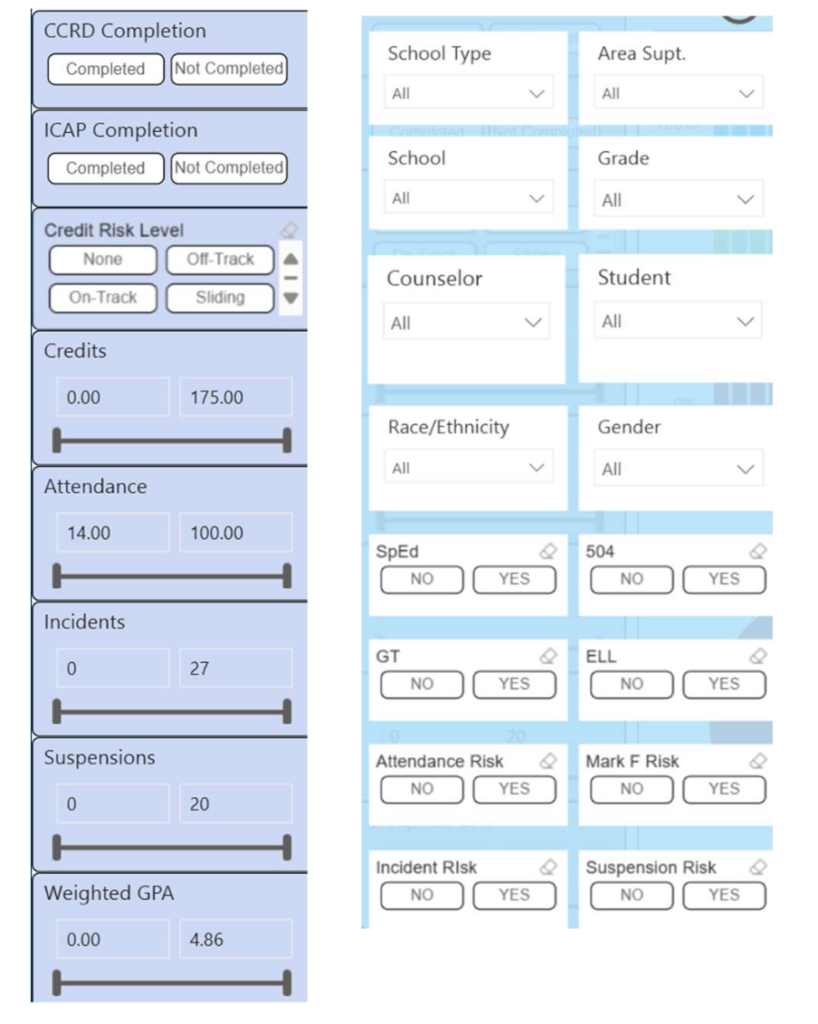
D11 developed custom EWIS dashboards through strategic collaboration between the district’s internal IT resources and PowerSchool. Their On-Track to Graduate (OTG) dashboard uses Power BI to create more accessible visualizations which apply their district-specific criteria to their prioritized on-track measures.
Student Success Teams now have access to an overall summary of On-Track status.
Impact
By creating a system that can respond to district-set criteria, rather than relying on generic vendor-provided cutoffs and thresholds, D11 can more effectively target students in need of support. Staff can now develop a holistic picture of any student with a few clicks rather than spending time compiling data from multiple systems, enabling faster and more comprehensive support decisions.
Strategy Fit
Consider this strategy if your district has:
- Student data housed in more than one system without a centralized student profile view
- A need for a consolidated, actionable, school-level Student Success Team holistic report
- Thresholds that are more nuanced than the ones fixed into your current system
- Difficulty identifying students who are off track for graduation
Roadmap
- Identify which student data sources house high-impact student-level indicator data
- Align on relevant thresholds to use to track important signals
- Determine the questions/hypotheses that reports should help Student Success Teams to address
- Design user-friendly reports that offer role-specific views
- Tie report use to existing Student Success Team meetings and data protocols
- Train schools to understand and use the available reports
- Bullet point style list on how to implement these learnings
Learn more about this district’s approach in the District-Led Innovation Showcase report.
Proactive Progress Check: How Lynwood’s Integrated Systems Prepare Reports to Highlight Critical On-Track Indicators
So What
Preparing reports around on-track indicators can help districts move from reactive student support to earlier, more strategic intervention planning.
Context Setting
Before refining its reporting practices, Lynwood Unified School District (LUSD) faced challenges identifying which students needed support before issues escalated. Student success teams often had access to large amounts of data, but lacked reporting structures that clearly prioritized student risk and highlighted where support was most urgently needed.
Innovation/Partnership
To improve early planning and intervention readiness, LUSD focused its reporting processes around on-track indicators tied to course performance, academic progress, and student success milestones. The district used integrated reporting systems to organize and review student data before the school year began, allowing educators and student success teams to identify patterns and prioritize support strategies earlier. This approach shifted reporting from a compliance-focused process to a more actionable planning tool.
Impact
By aligning reports around on-track indicators, LUSD improved teams’ ability to identify students needing support earlier and coordinate intervention planning across schools and departments. Educators were better positioned to prioritize student needs before challenges became more difficult to address.
Strategy Fit
Consider this strategy if your district has:
- Difficulty determining which students should be prioritized for support
- Reporting systems that provide too much disconnected or difficult-to-interpret data
- Reactive intervention processes that occur after students have already fallen behind
- Limited visibility into patterns across student groups
- Challenges coordinating student support planning across teams
Roadmap
- Identify which on-track indicators are most important for student success planning
- Align reporting structures around key student success milestones
- Configure dashboards or reports to prioritize risk visibility
- Create shared review processes for student success teams
- Develop workflows for using reports during intervention planning
- Refine reporting structures based on team feedback and student support needs
Learn more about this district’s strategy in the District-Led Innovation Showcase report.